Josh Atwal

Facial Expression Analysis
1 March 2023
Apple’s Photos app automatically groups images of the same person together. I had the idea to use this to construct a dataset of my own facial expressions over the years. I then used a pre-trained model to quantify the expressions and performed an analysis of how my facial expressions in photos have changed over time.
The objective was to try and see if there was any way to use facial expressions as a quantitative measure of mental health.
The code for this project is available as a jupyter notebook.
Methodology
The first step was to export all images of my face from the photos app. For comparison, I also used a publically available selfie dataset.
I used the FER package to handle facial detection and expression classification. The model doing the detection and classification was MTCNN, a convolutional neural network.
The model outputs a probability distribution over the 7 basic emotions (anger, disgust, fear, happiness, sadness, surprise, neutral). The emotion with the highest probability is taken as the dominant emotion in the image. The intensity of the dominant emotion is taken as the probability of the dominant emotion. For example, if the model predicts that the dominant emotion in an image is happiness with a probability of 0.8, then the intensity of happiness in that image is 0.8.
The rest was just the usual data processing and visualisation using pandas/matplotlib/seaborn. All statistics were first grouped by the day they were taken on, this avoids similar photos from the same shooting having an undue biasing effect.
Results
Most potent examples
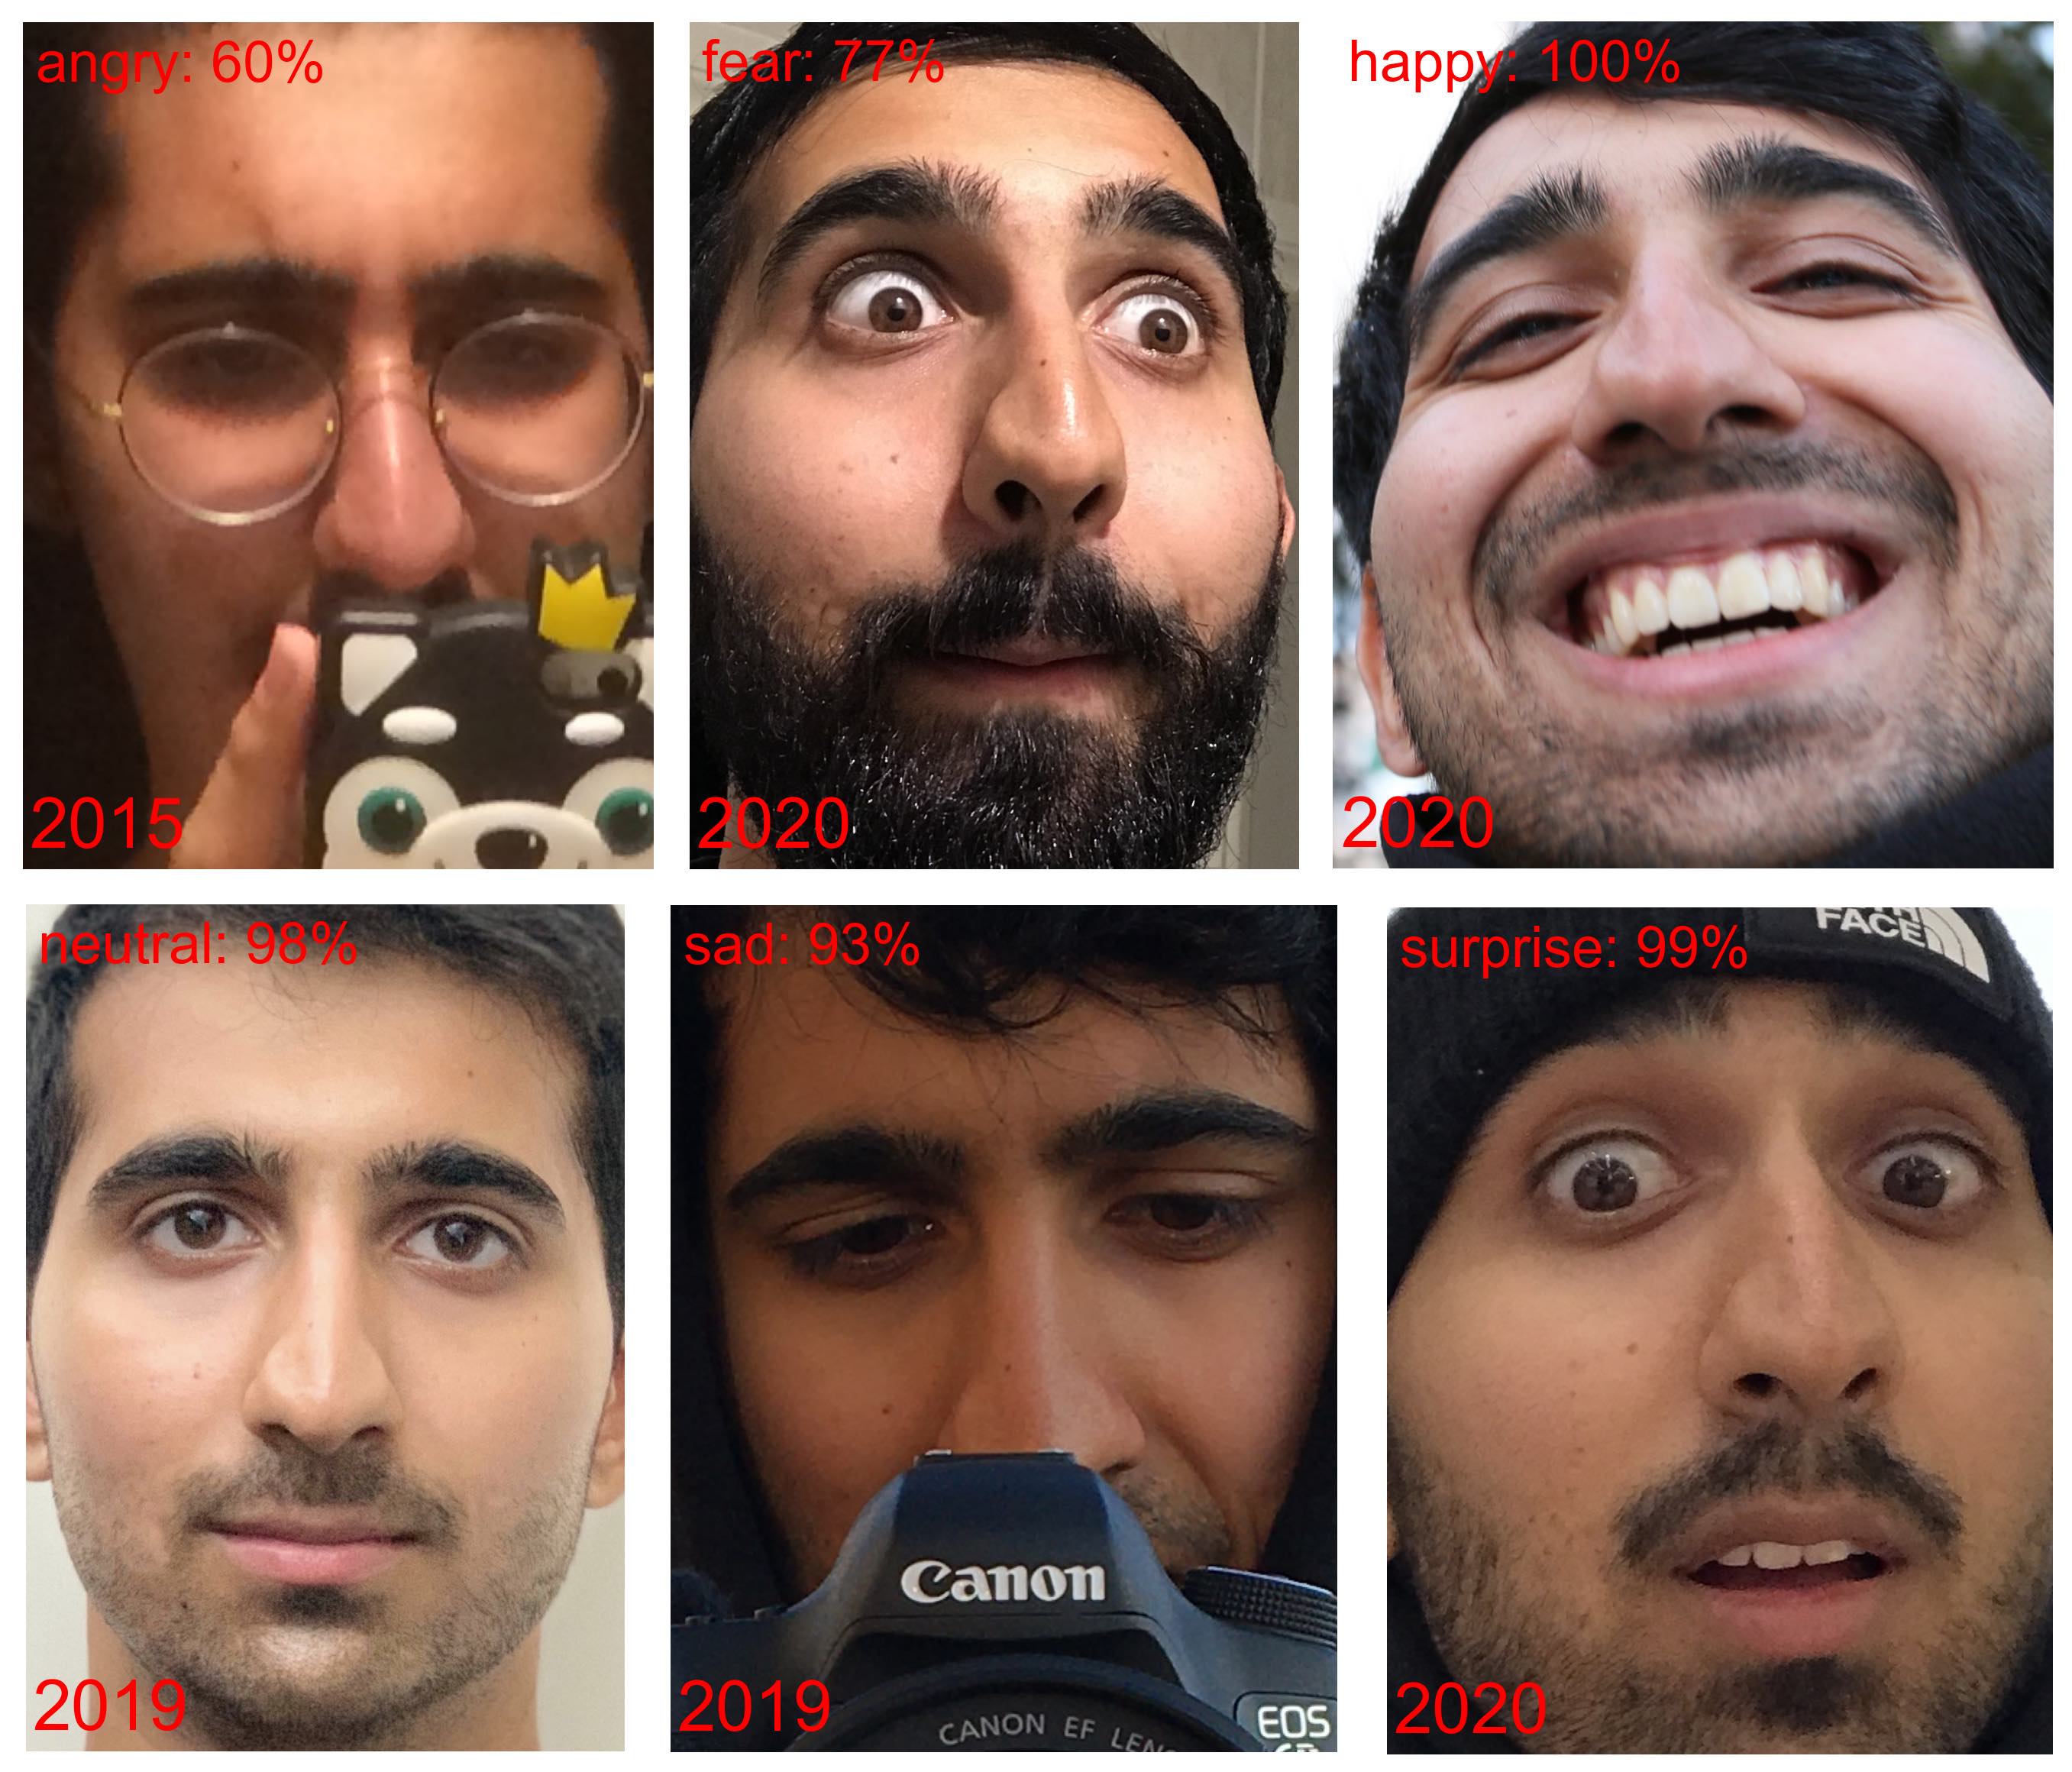
Figure 0 shows the most “potent” example of some of the available expressions over the entire dataset. The model seems to be less confident at detecting anger and fear (disgust was even worse). Perhaps not many examples of these expressions existed in the training

Figure 0: Most potent examples of each type of expression
Emotions over time
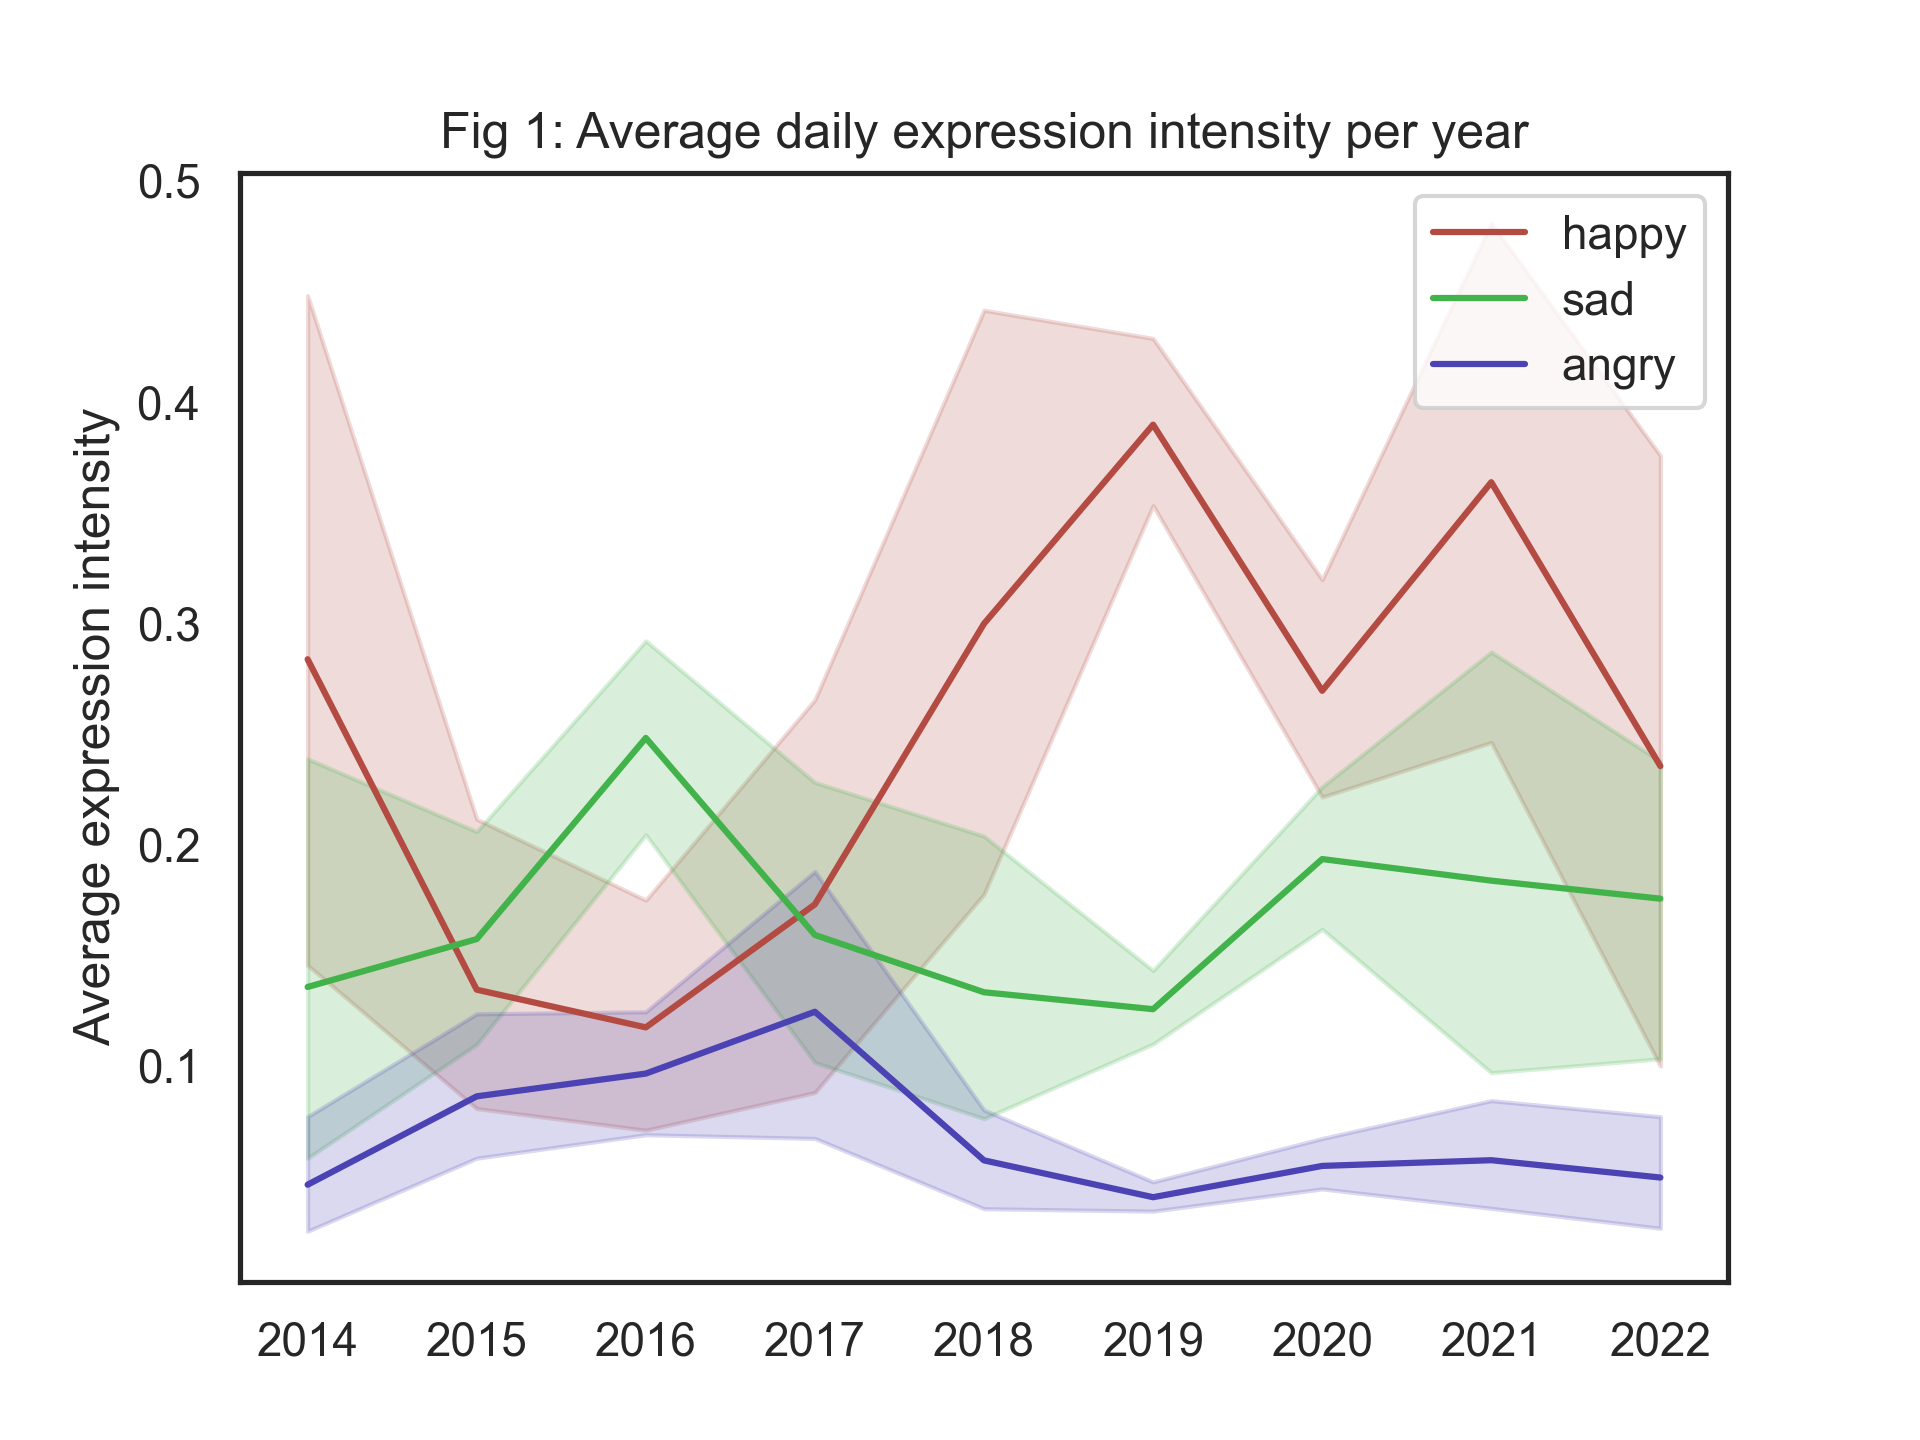
Figure 1 shows how the expression intensity changes over time. The most happiness in images was observed in 2019 with an average happiness across all images of 0.40, while the lowest point was in 2016 with an average happiness of 0.12. As you might expect, sad and happy expressions are inversely correlated. Anger also seems to loosely track sadness.
This is fairly consistent with my mental health during these times. In 2019 I was finishing my final year of university on exchange in Germany. Meanwhile in 2016 I was in my second year of university and coming to grips with the heavy workload of a conjoint degree.

Figure 1: Average daily expression intensity per year
Dominant emotion over time
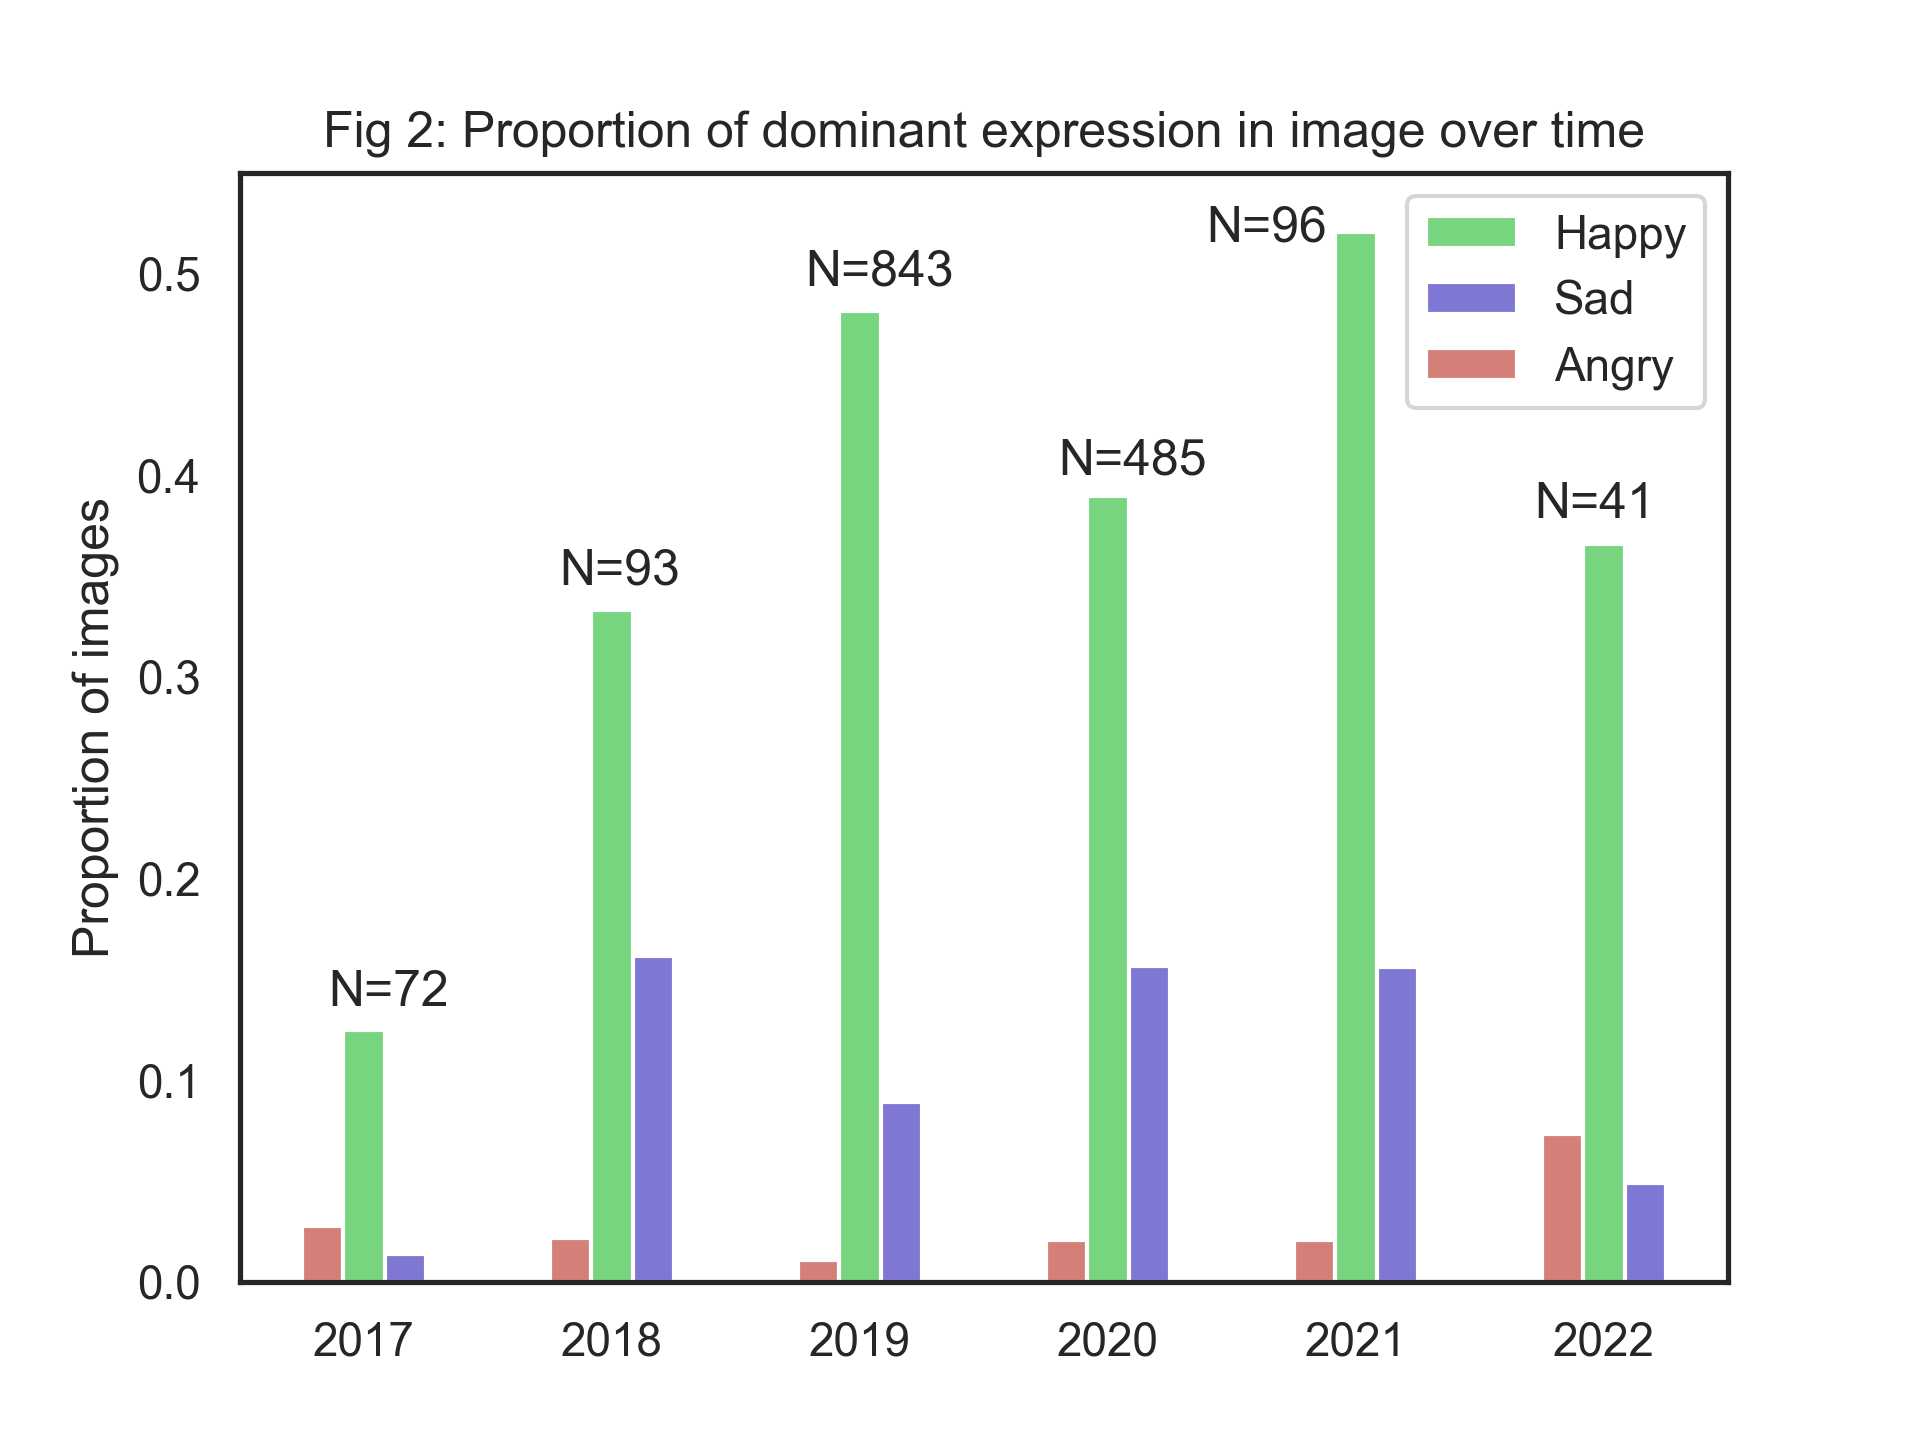
Figure 2 looks at the dominant expression in each image, with N denoting the number of images available from that year. For example, of the 843 images of my face taken in 2019, almost half of them had ‘happy’ as the dominant expression. The unseen remaining proportion comprises the rest of the expressions (mostly ‘neutral’).
These results seem to mostly corroborate the story of Figure 1. The dominant emotion is perhaps a more reliable indicator of emotional state, as it is unlikely that a facial expression is a mixture of emotions.

Figure 2: Proportion of dominant expression in image over time
Comparison with other people
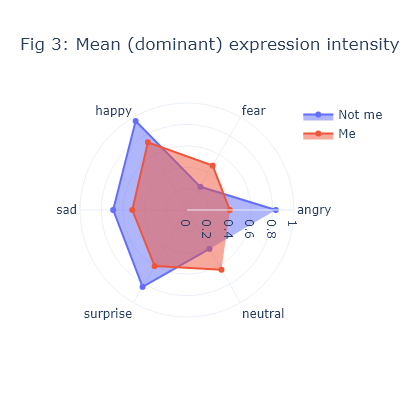
Figure 3 compares my expressions against those of other people. Over 100,000 selfies of other people were collected from publicly available sources. The intensity of each expression (when that expression was the dominant emotion in an image) was computed for both my photos and the corpus of other people’s selfies.
For example, for happy images, it seems to suggest that my expression of happiness is less intense than in other people. Some other potential explanations include:
- The model was more confident in recognising happiness in other people
- The distribution of expressions in the dataset of others included happier photos
- I am less expressive than others
In reality it is likely a combination of these explanations, and perhaps others. It is also possible that the model is biased towards certain types of faces, and that my face is not one of them.

Figure 3: Proportion of dominant expression in image over time
Discussion
When I began this project I had imagined making evidenced conclusions about how my emotional state and mental health has varied over the years. However, there are many biases involved in the data (when do you tend to take photos?) and the model (every model comes with inherent biases towards perhaps certain emotions that are not independent of the physiognomy of the subject). Furthermore, research suggests that external expression is often not as good an indicator of internal emotions as some like Darwin had thought.
However, I think that this project is a good demonstration of how data science can be used to explore and quantify things that we would not normally think of as being quantifiable. It also shows how easy it is to make incorrect conclusions from data, and how important it is to be aware of the biases in the data and the model. It would be interesting in the future to see how the results change with a different model, or with a different dataset.